Warning: The `<scale>` argument of `guides()` cannot be `FALSE`. Use "none" instead as
of ggplot2 3.3.4.
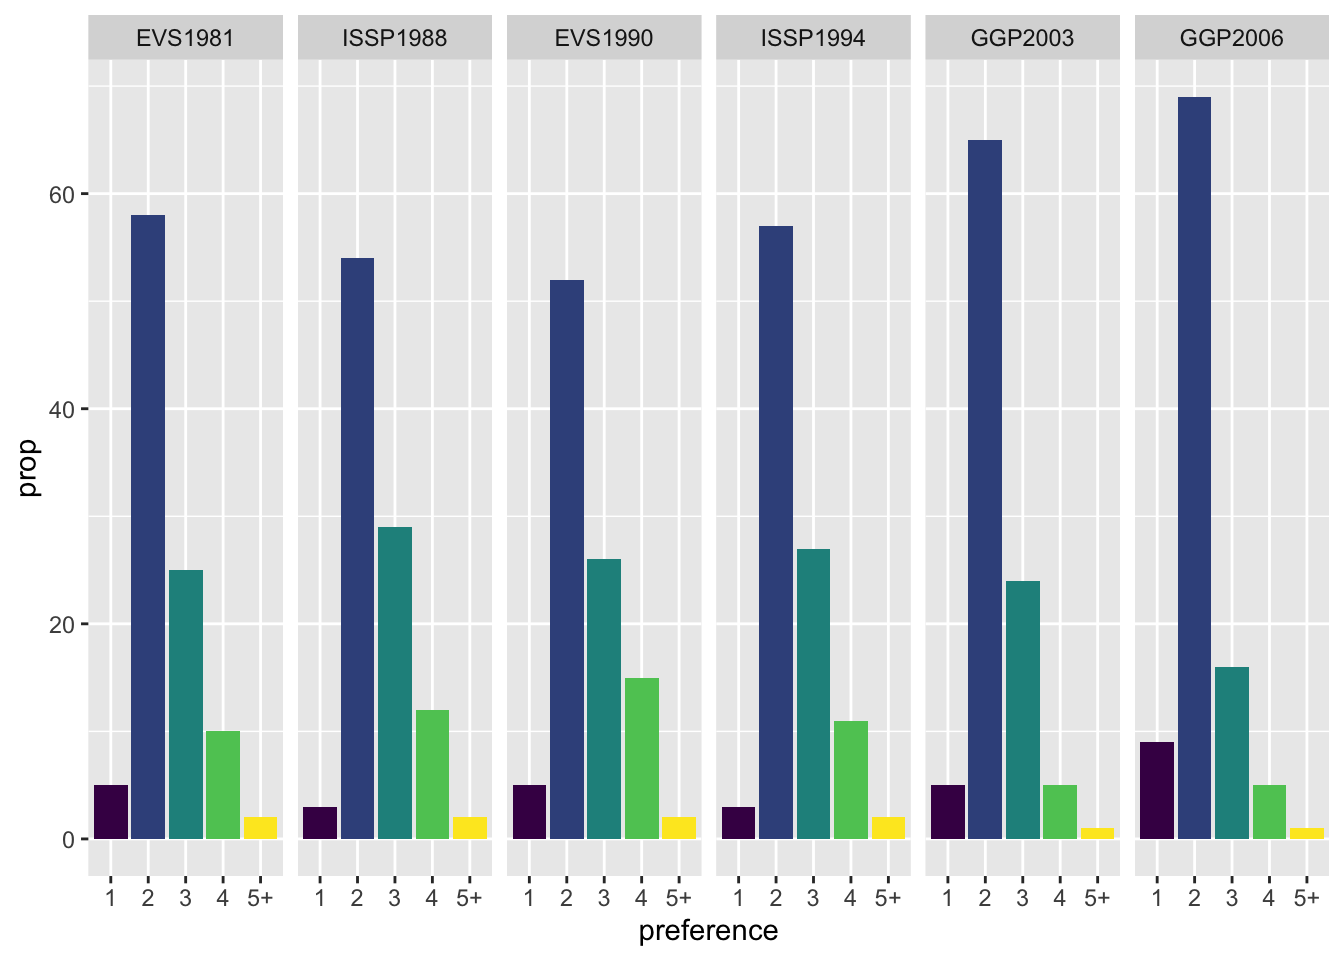
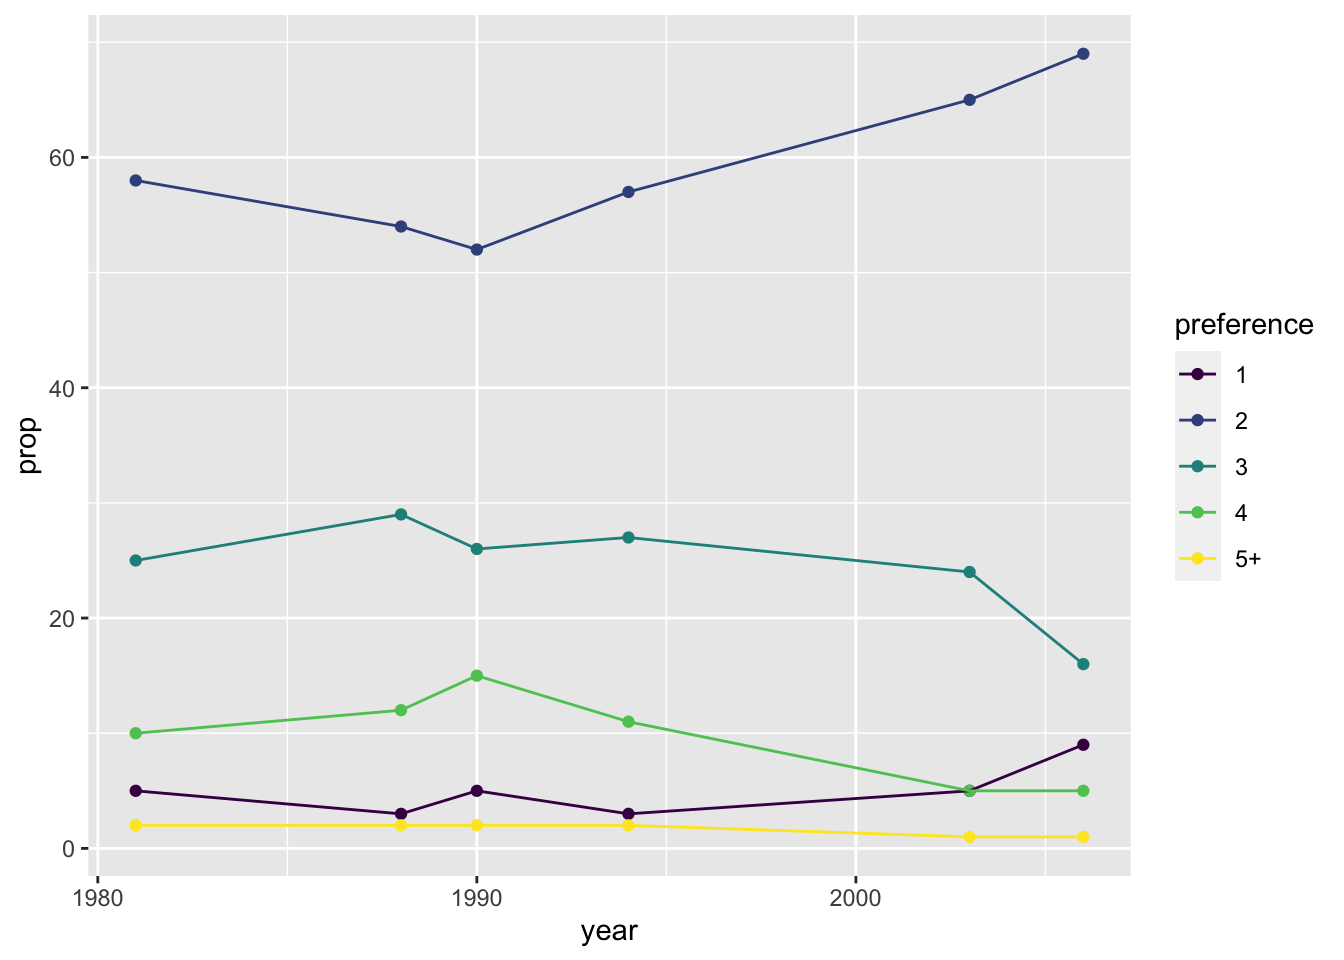
sm <- sm %>%mutate(year =case_when( Study =="EVS1981"~1981, Study =="ISSP1988"~1988, Study =="EVS1990"~1990, Study =="ISSP1994"~1994, Study =="GGP2003"~2003, Study =="GGP2006"~2006 ))ggplot(sm, aes(x = year, y = prop, colour = preference)) +geom_point() +geom_line() +#guides(fill = FALSE) +scale_colour_viridis_d()